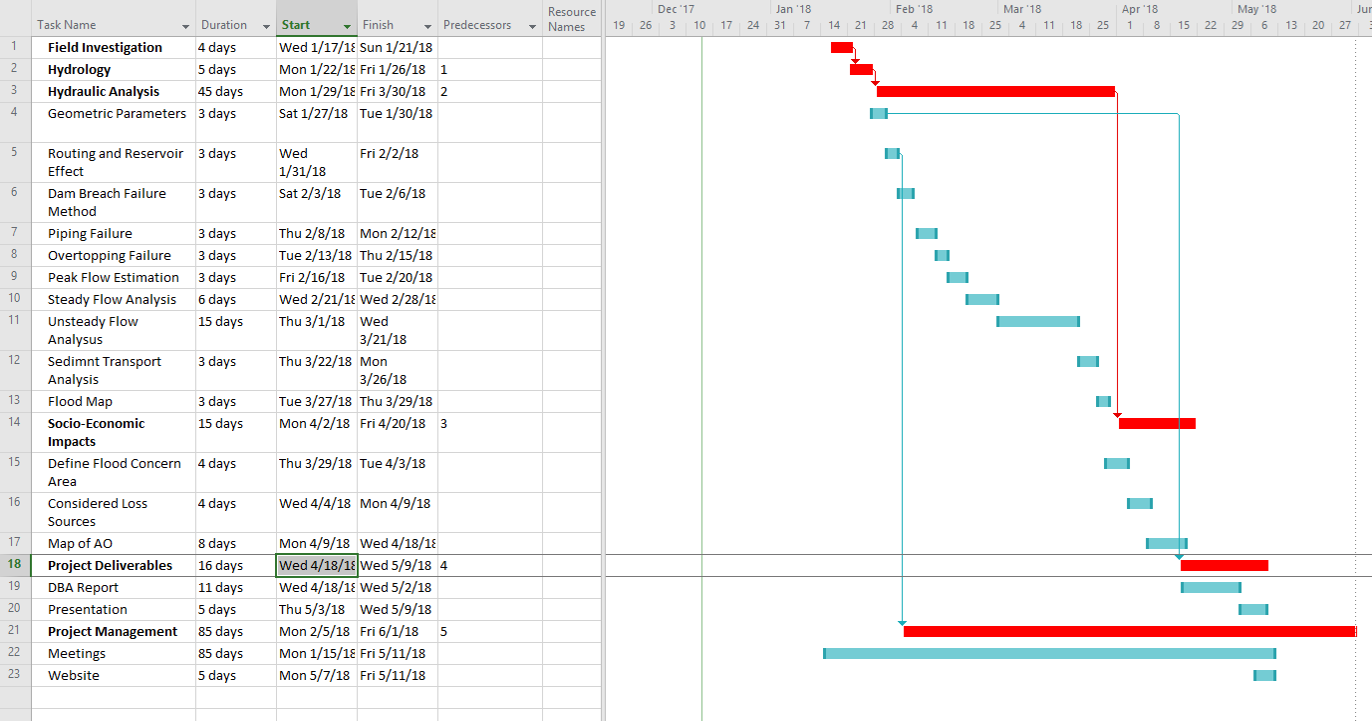
Tasks

Task 1: Field Work
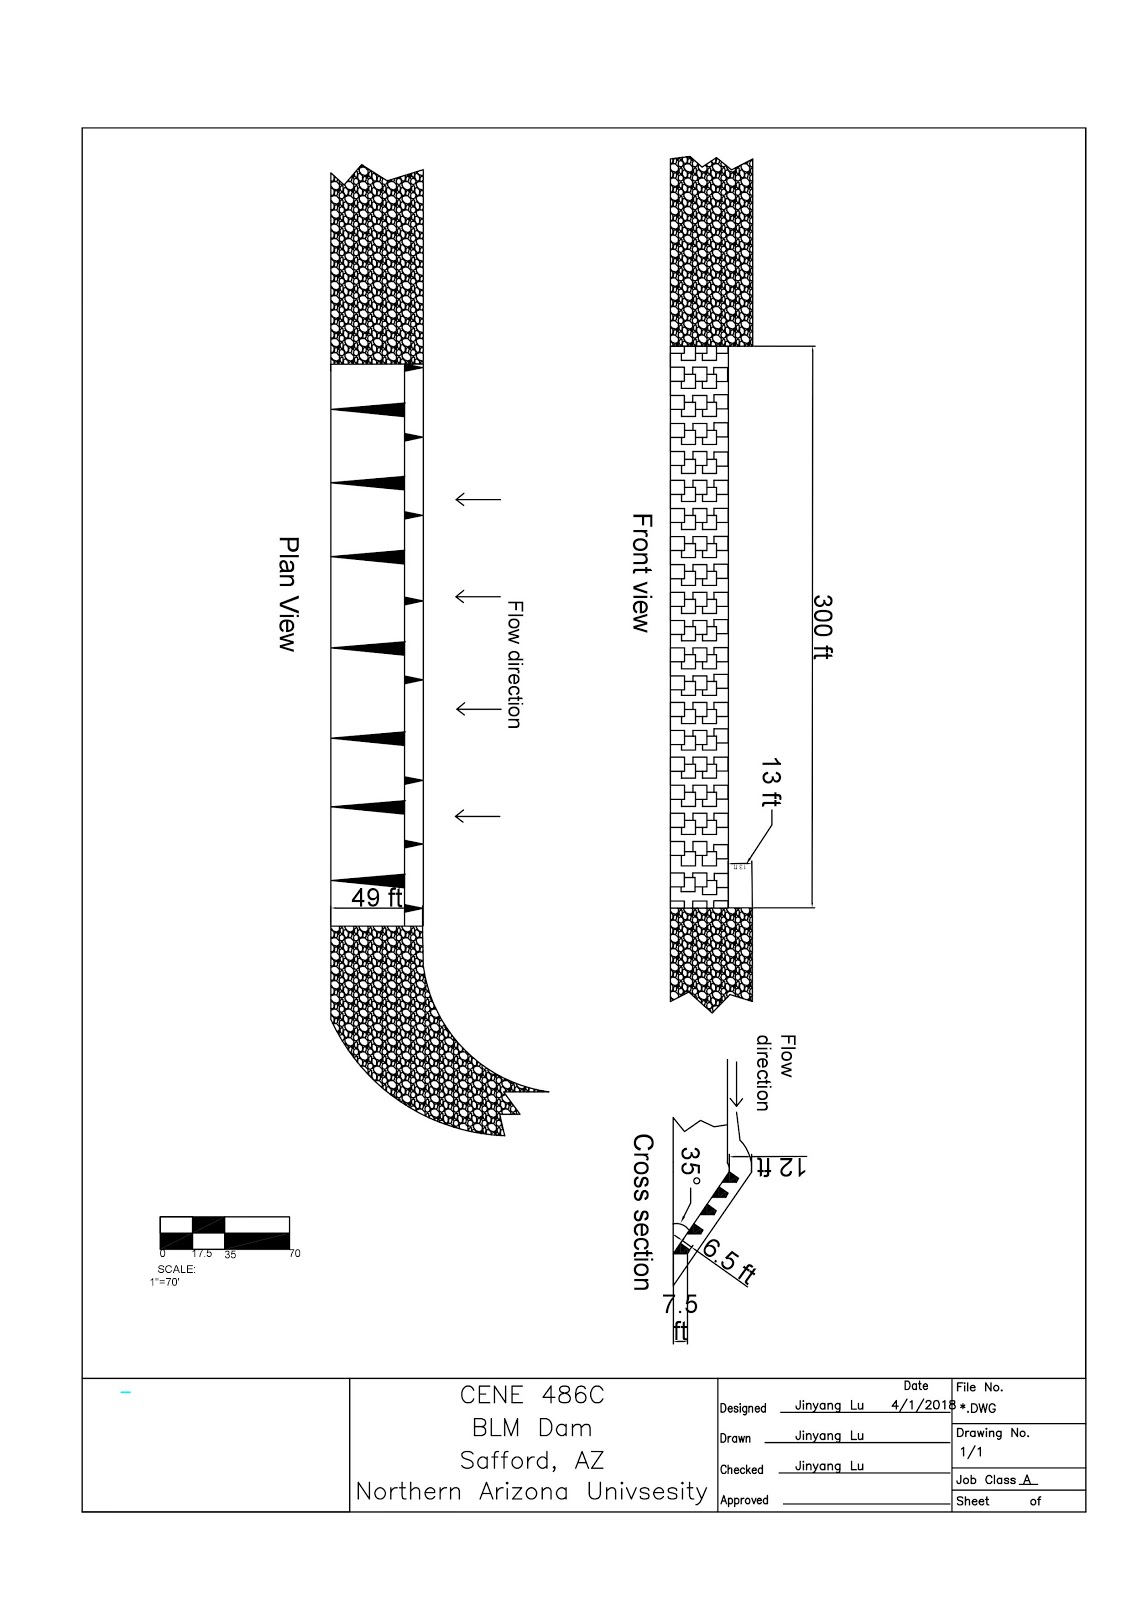
The observations included the density of overgrowth both upstream and downstream of the spillway. The amount of sediment transfer that has occured at the site and where it is evident that at least one row of baffle blocks has been buried in sediment and brush.

AutoCAD Drawing of Dam
Task 2 and 3 : Hydrology & Hydraulic
Hydrologic Engineering Center - River Analysis System (HEC-RAS) is a one-dimensional hydraulic simulation program based on four kinds of analysis of rivers. The first being a stable flow model, next an unstable flow model, sediment transport models, and finally a water quality analysis model if necessary. It can simulate the flow of natural riverbed or human-made channels to determine the water level as its primary goal is to carry out flood studies and identify flooded areas. HEC-RAS consists of a series of programs, tools, and uses for processing georeferenced data, and teams can import geometric data into HEC-RAS. The HEC-geoRAS file collects data on the geometry of the study area, including river beds, cross-sections, waterways and more. Hydraulic calculations can obtain velocity and depth results. Finally, the program can communicate with ArcGIS for processing to create a severity index map showing locations of pooling.


Task 4: Socio-Economic Impacts
The dam basin system is located just outside the city limits of Safford, AZ leading to concerns about floods and resulting economic damage for the city and surrounding agricultural land, in the event of a dam failure. The team must determine if a flood and dam breach does occur and will the damage be contained to the farmlands outside of Safford, or will the water cause damage inside the city limits.
| Area category | Zoning Standard | Property loss rate% | Indirect loss factor(λ/%) | ||
|---|---|---|---|---|---|
| Submerged depth(m) | Maximum flow rate(m*s^-1) | Flooding duration(h) | |||
| Breakout area | >2.0 | 60 | |||
| >3.5 | |||||
| Breakout area | 2-3.5 | >2.0 | >12 | 90 | 57 |
| Area | |||||
| Severe disaster area | 1-2 | 1.0-2.0 | >24 | Calculated with general flood property loss rate | 50 |
| Moderate disaster area | 0.5-1 | 0.5-1.0 | >120 | 45 | |
| Light disaster area | 0.1-0.5 | 0.1-0.5 | <48 | 30 | |
| Safe area | 0-0.1 | 0-0.1 | <0.5 | 0 | 10 |
Dam breach economic loss formula: S=αW(1+λ)
- S is the dam economic total loss ($);
- α is the dam flood loss property loss rate;
- W is the property value ($) in the submerged area;
- λ is the indirect economic loss conversion factor of dam break;
- αW is the direct economic loss caused by dam collapse.
Task 5: Project Deliverables
The deliverables produced from this project will be a finished DBA report including damages and the damage impact area in Safford, AZ. This report will be grouped with a comprehensive website containing all of the project information and all useful research documents used on the project. This can help future teams continue the San Simon basin project and expand the scope of the project to meet more BLM requests. A final in-person presentation will be provided at the conclusion of the project that will include all resulting data and findings.
Task 6: Project Management
Project management is throughout the project's life and it is to meet the needs of the project as they come up. Management includes holding meetings, organizing presentations, and other major tasks.